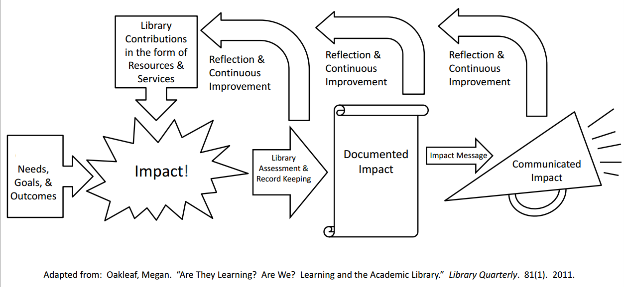
What I’ve come to love about the library science field (which after years of waiting tables you’d think I’d hate) is the service aspect to everything we do. Librarians are intensely user-focused in all of our work: through the use of needs assessment surveys, we mold our libraries to what users want, expect, and need. We use the results to design programs, buy technology, even create positions within a library (YA librarian is a thing because of that!). Some common ways to implement a library assessment include focus groups, interviews, scorecards, comment cards, usage statistics from circulation and reference, and surveys sent to users via email or on paper.
This past week, I attended a workshop with the fabulous Julia Kim at METRO that focused on the implementation and design aspects of surveying, called “Assessment in Focus: Designing and Implementing an Effective User Feedback Survey.” The presenter, Nisa Bakkalbasi, the assessment coordinator at Columbia University Libraries/Information Services, was a former statistician and presented on the many ways one could glean statistically valuable quantitative data from simple survey questions.
The first part of this workshop dealt with the assessment process and types of survey questions, while the second dealt mainly with checking your results for errors. I will focus here on the first part, which is about data gathering and question manufacturing.
I will touch briefly on the assessment process by saying this: all the questions asked should be directly relatable to all the objectives laid out in the beginning of the process. Also, that surveying is an iterative process, and as a library continues to survey its users, the quality of the survey to get valuable results will also increase.
While my work at AMNH is conducted solely through interviews, I found that the discussion Nisa had on the types of questions used in survey design was particularly helpful. She focused the session on closed-end questions, because there is no way to get quantitative data from open-ended questions. All the results can say is “the majority of respondents said XYZ,” as opposed to closed-ended questions where in the results its “86% of respondents chose X over Y and Z.” This emphasize was extremely important, because real quantifiable data is the easiest to work with when putting together results to share in an institution.
When designing survey questions, it is important to keep a few things in mind:
- Ask one thing at a time
- Keep questions (and survey!) short and to the point
- Ask very few required questions
- Use clear, precise language (think The Giver!)
- Avoid jargon and acronyms!
The two most common closed-ended questions are multiple choice questions:
and rating scale questions:
For multiple choice questions, it is important to include all options without any overlap. The user should not have to think about whether they fit into two of the categories or none at all. For rating scales, my biggest takeaway was the use of even points for taking away any neutrality. While forcing people to have opinions is considered rude at the dinner table, it is crucial to the success of a survey project.
Both of these types of questions (and all closed-ended questions) allow for easy statistical analysis. By a simple count of answers, you have percentage data that you can then group by other questions, such as demographic questions (only use when necessary! sensitive data is just that–sensitive) or other relevant identifying information.
In terms of results, this can be structured like: “78% of recipients who visit the library 1-4 times a week said that they come in for group study work.” These are two questions: what is your primary use of the library, and how often do you come in, both multiple choice. These provide measurable results, critically important in libraryland and something librarians can utilize and rely heavily upon.
I also want to briefly discuss more innovative ways libraries can begin to use this incredible tool. Proving value–the library’s value, that is. Libraries traditionally lose resources in both space and funding due to a perceived lack of value by management, the train of thought usually that since libraries aren’t money-makers, it inherently has less value to the institution.
We as librarians know this to be both ludicrous and false. And we need to prove it. If the result the library is looking for says something like “95% of recipients said that they could not have completed their work without the use of the library,” then that is a rating scale question waiting to happen. And an incredible way to quantitatively prove value to upper management.
Quantitative data gathered via strategic surveying of user groups can be a powerful tool that librarians can–and should!–use to demonstrate their value. In business decisions, the hard numbers do more than testimonials. Library directors and other leaders could have access to materials that allow them to better represent the library to upper management on an institution-wide level. This can be the difference between a library closure and a library expansion, especially in institutions where funding can be an issue.
Librarians can and should use these surveys for their own needs, both internally for library services and externally on an institution-wide scale. Whether you are a public library trying to prove why you need a larger part of the community’s budget, or a corporate library vying for that larger space in the office, the needs assessment survey can prove helpful to cementing the importance of a library as well as development of library programs.
In the words of Socrates, “an unexamined life is not worth living.”


